My Projects
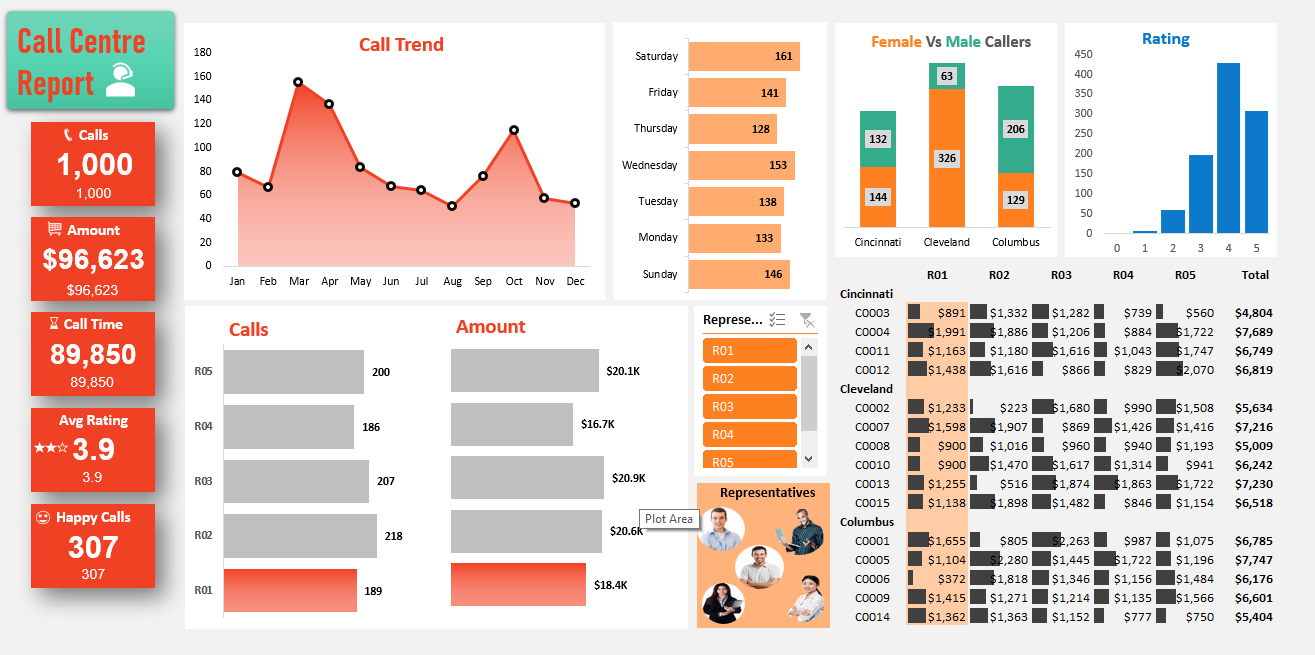
Call Centre Report
This project involved analyzing call center performance data to identify key operational metrics and trends. I performed data cleaning, preprocessing, and analysis, followed by the creation of a comprehensive dashboard. The dashboard provided insights into call volumes, agent performance, customer satisfaction levels, and average handling times. This analysis helped highlight areas for operational efficiency improvements and provided actionable recommendations for enhancing service quality and customer experience.

Digital Music Store Analysis (SQL)
In this project, I used SQL to analyze customer spending patterns, popular genres, and top-performing artists for a digital music store. Through advanced SQL queries, I extracted insights on the most profitable cities, best customers, and the top genres by country, providing data-driven recommendations to enhance marketing strategies and optimize inventory management. This project demonstrates my ability to work with large datasets and solve real-world business problem solve real-world business using SQL.
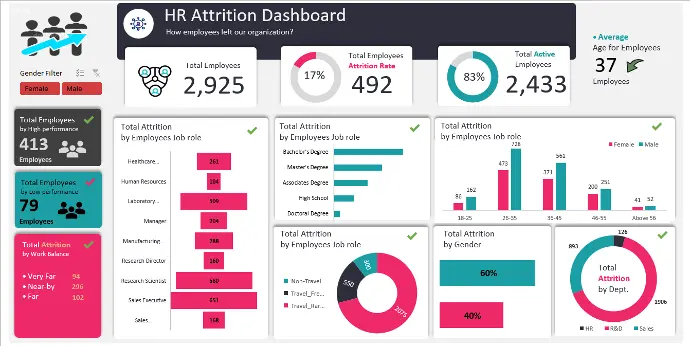
HR Attrition Analysis
In this project, I conducted an in-depth analysis of employee attrition data using Excel. The process involved collecting, cleaning, interpreting, structuring, and transforming data to uncover key insights. I developed a comprehensive dashboard that highlights critical factors contributing to employee turnover, enabling businesses to make data-driven decisions to enhance employee retention.

Airlines Passengers Satisfaction Analysis
This project involved a detailed analysis of passenger satisfaction using Excel. I employed advanced techniques including data preprocessing, cleaning, sorting, modeling, and visualization to develop an interactive dashboard. Key findings include insights into overall satisfaction levels, travel types, class distributions, gender and age demographics, and the relationship between flight distance and satisfaction.
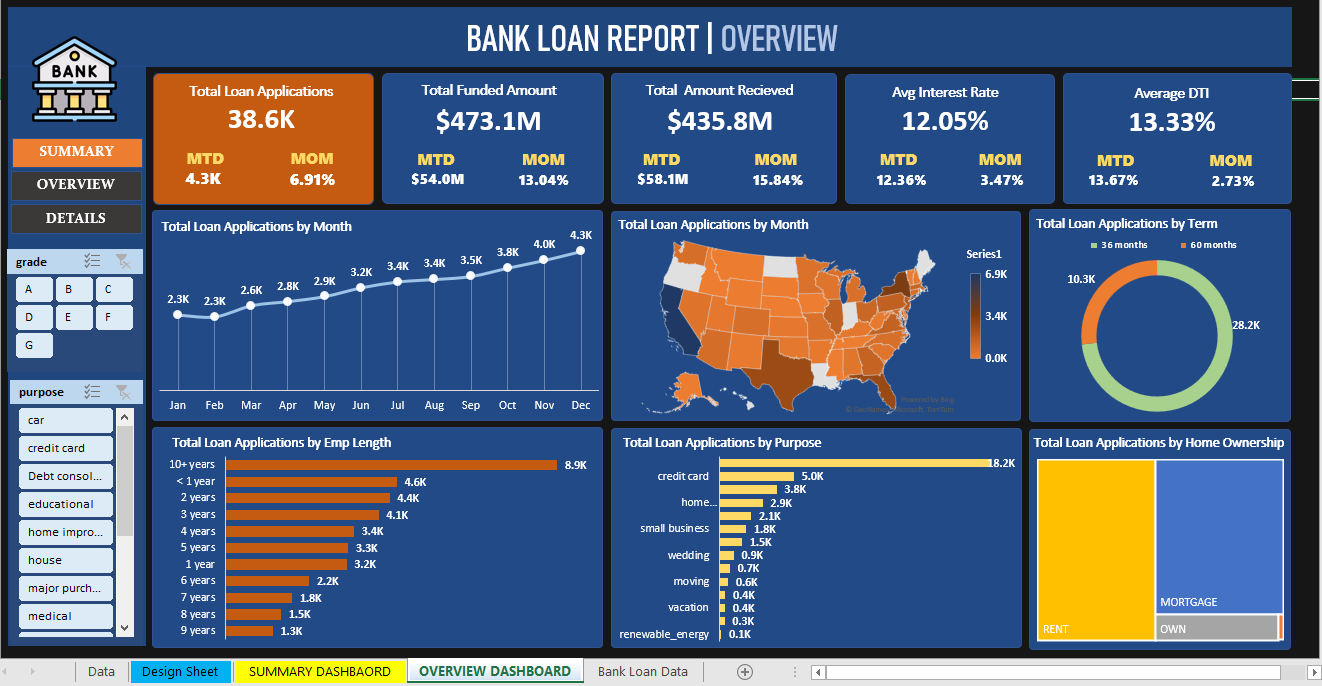
Bank Loan Report
In this project, I analyzed a massive bank loan dataset using Excel, focusing on data cleaning, structuring, modeling, and analysis. I created two dynamic dashboards: a Summary Dashboard for high-level insights and an Overview Dashboard for detailed analysis. Additionally, I designed a sheet with pivot tables to enhance data exploration. This project showcases my ability to turn complex data into actionable insights.
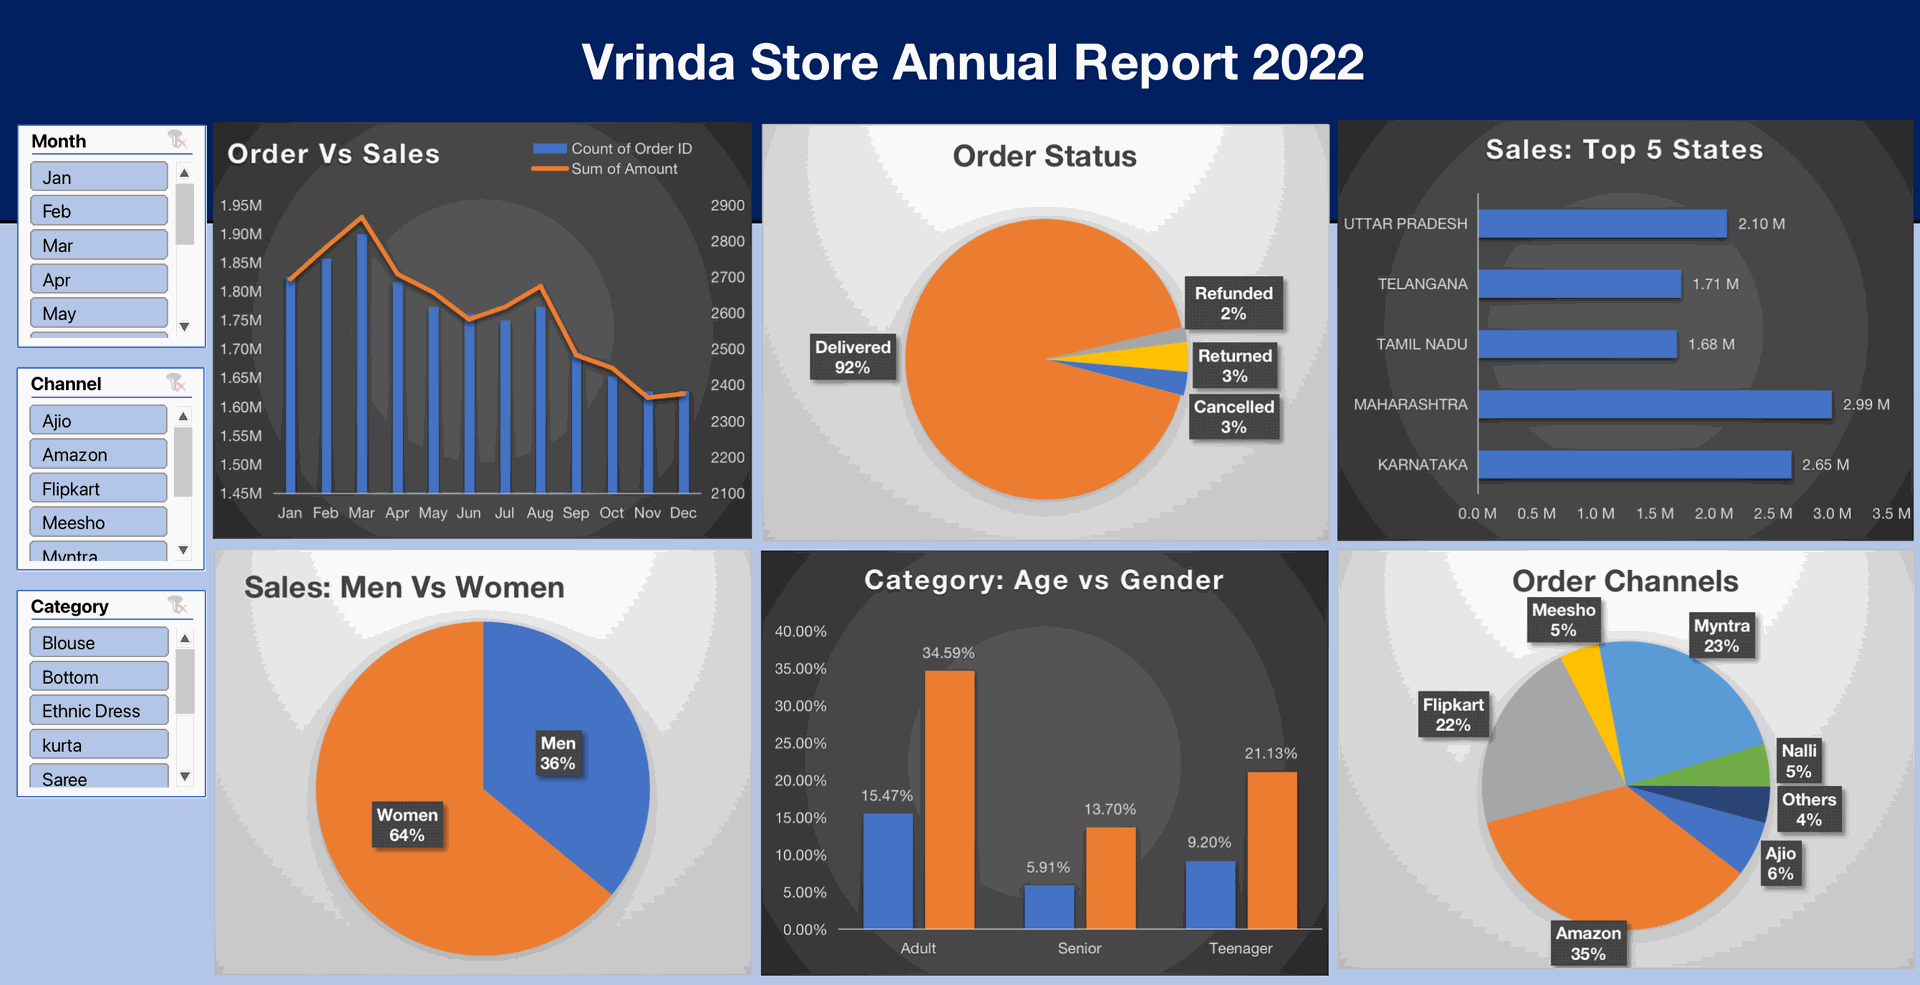
Vrinda Sales Annual Report
The Vrinda Store Annual Sales Analysis Report for 2022 provides a comprehensive overview of the sales performance, order status, demographic trends, and preferred sales channels throughout the year.
BlinkIt Data Analysis
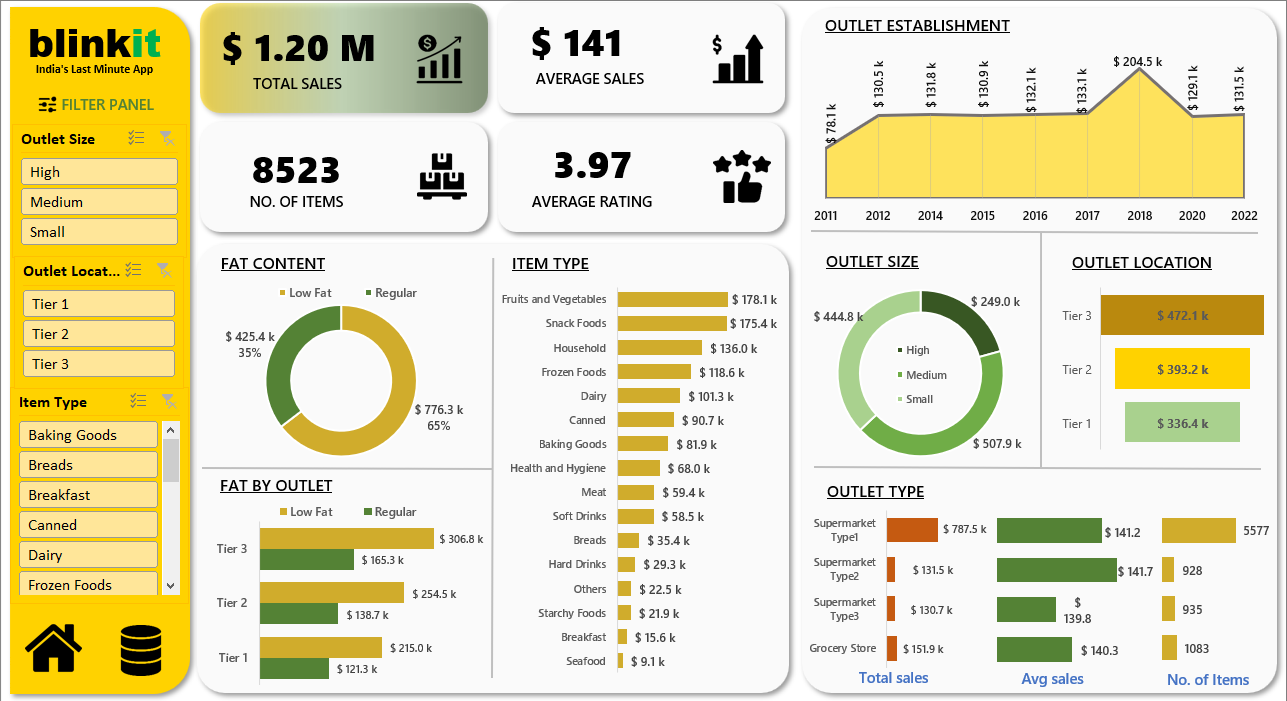
In this project, I analyzed Blinkit's real-time sales data using Microsoft Excel, transforming raw data into meaningful business insights. The goal was to uncover key performance metrics across various dimensions such as outlet size, location, item type, and customer preferences. The final deliverable was an interactive, dynamic dashboard that provides stakeholders with actionable insights to drive data-driven decision-making.
Road Accident Analysis
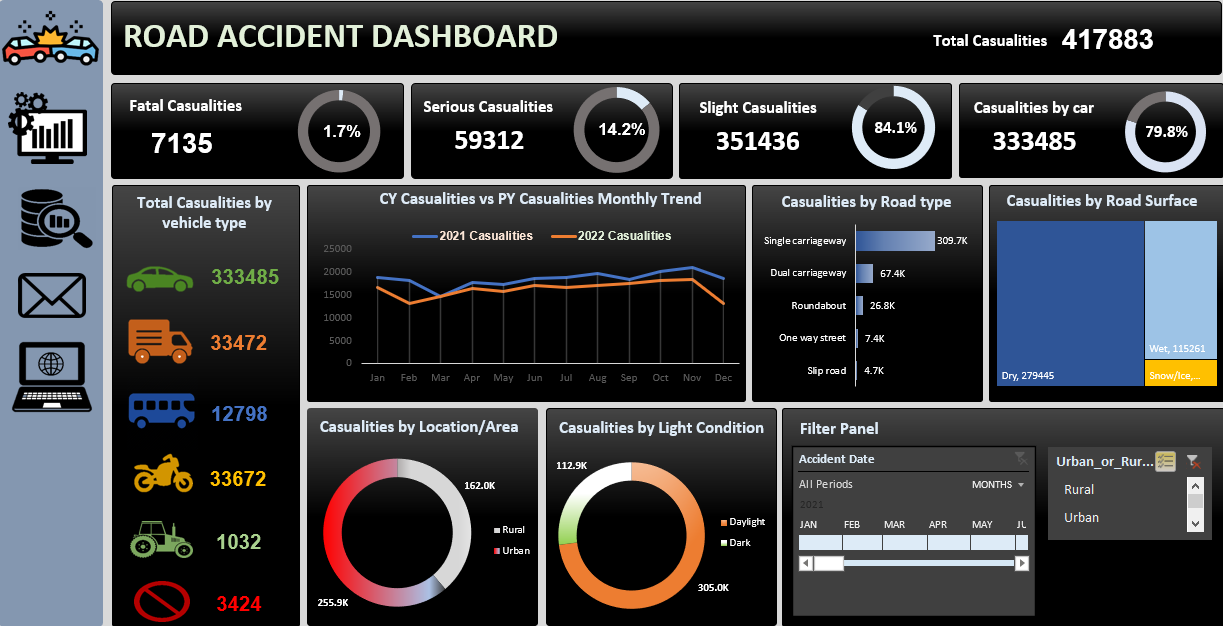
This project involves the creation of a comprehensive Road Accident Dashboard using Excel. The dashboard provides a detailed analysis of road accident data, enabling users to visualize and interpret key metrics and trends. The primary focus is on various aspects of road safety, including casualty types, vehicle types, road conditions, and light conditions.

Sales Analysis
In this Tableau project, I analyzed product sales and profit data to uncover valuable insights. The analysis focused on identifying top-selling products, understanding profit distribution across different categories, and visualizing sales and profit trends over time. The interactive dashboard I created allows for an intuitive exploration of the data, making it easier to identify patterns and drive business decisions.

Coffee Shop Analysis
Developed a dynamic dashboard in Excel to track and analyze coffee sales performance, providing real-time insights into key parameters such as:
- Sales trends and growth
- Top-selling products and regions
- Customer behavior and preferences
- Revenue and profit margins
IPL Analysis
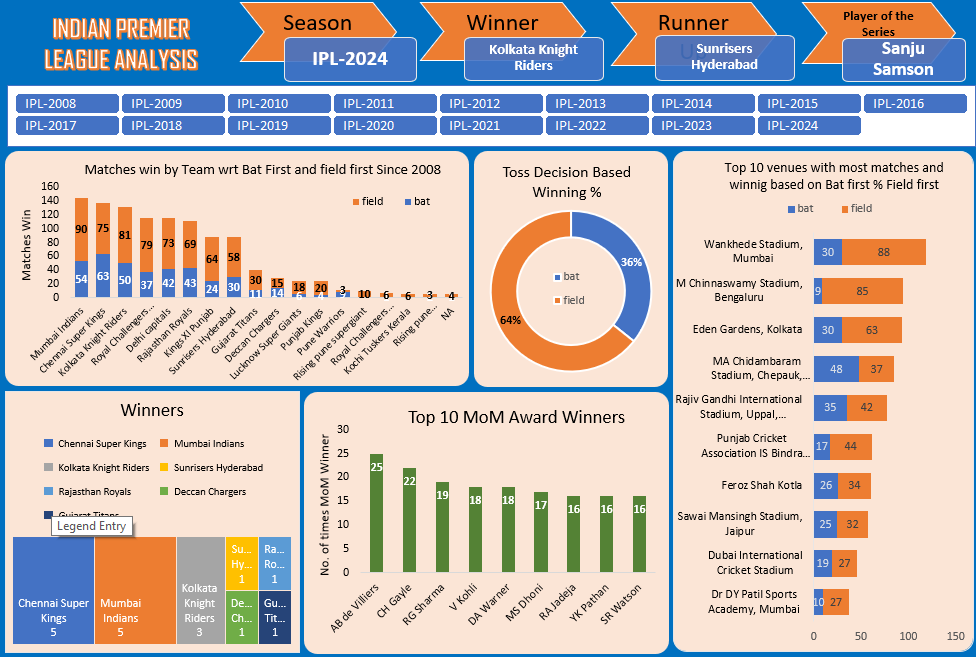
In this project, I performed a comprehensive analysis of Indian Premier League (IPL) data, focusing on team performance, match outcomes, and player achievements. The process involved data cleaning, manipulation, and modeling, resulting in a dynamic Excel dashboard that offers insights into winning patterns based on toss decisions, batting/fielding strategies, and venue statistics.

Amazon Sales Report
Created an Excel dashboard to analyze Amazon sales, focusing on profit, sales trends, and top-performing products. Managed and cleaned large datasets, delivering key insights through clear, interactive visualizations. This project demonstrates my proficiency in data analysis and visualization.
Electricity Consumption Analysis
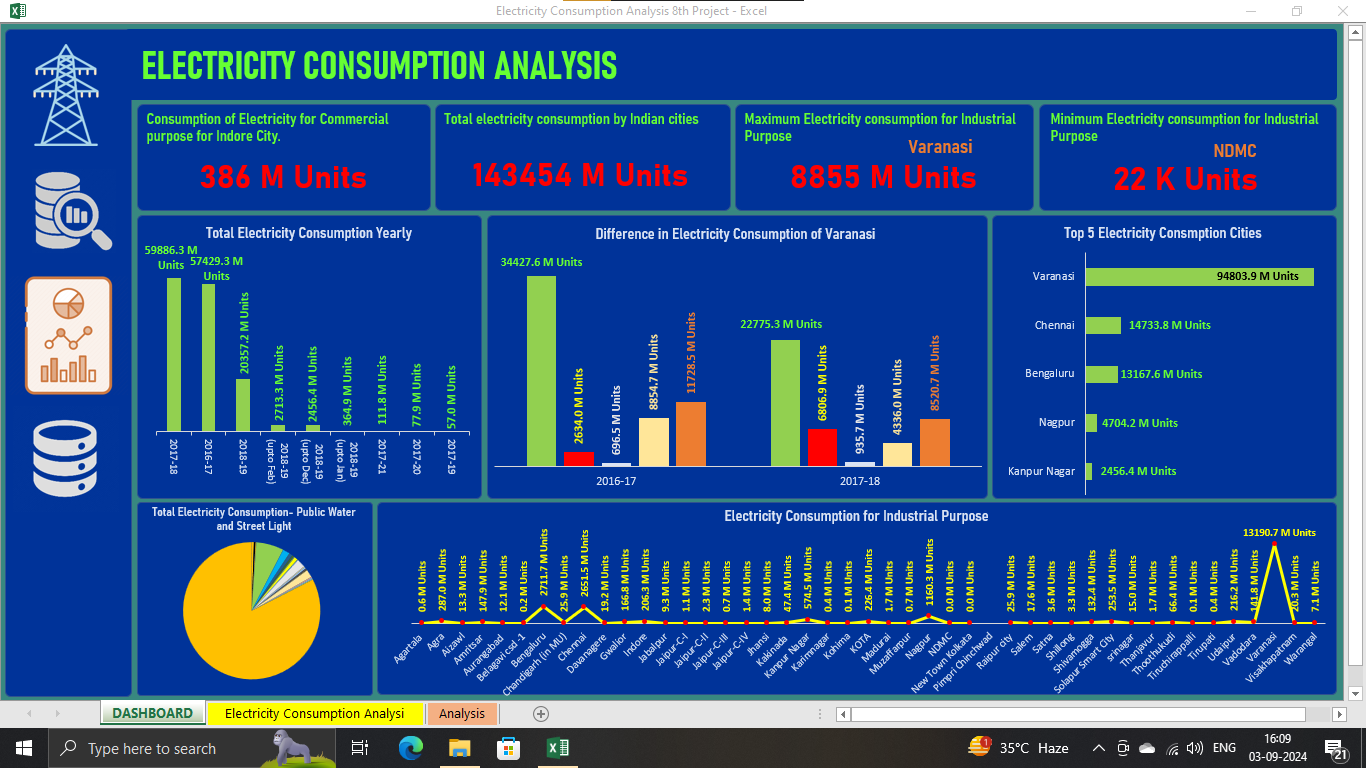
This project analyzes electricity consumption across various Indian cities, focusing on commercial, industrial, and public utility sectors. The dashboard presents key insights such as total electricity usage, city-wise comparisons, and year-on-year consumption trends. Major cities like Varanasi, Chennai, and Bengaluru are highlighted for their high electricity consumption.